E-ISSN:2583-9152

Research Article

Glasses & Ceramics, Composites

Journal of Condensed Matter

2023 Volume 1 Number 2 Jul-Dec
Publisherwww.thecmrs.in

Structural characterisation of Pr3+ ions incorporated sodium lead Barium borate glasses

Lenkennavar S1*
DOI:10.61343/jcm.v1i02.30

1* Susheela K Lenkennavar, Department Of Physics, Bangalore University, Bangalore 560056, Karnataka, India.

The Structural properties of 20Na2O – 10PbO – 10BaO –B2O3 – xPr2O3 glass doped with praseodymium have been investigated. The characterization techniques used for studying rare earth-doped glasses include energy-dispersive X-ray analysis (EDS), Fourier-transform infrared spectroscopy (FTIR), X-ray diffraction (XRD), and scanning electron microscopy (SEM) for structural investigations. The concept of physical parameters plays a fundamental role in estimating the strength and structural compactness of the synthesized glass. Consequently, we investigated the influence of rare earth ions (Pr3+) concentration on physical properties. The nature and composition of the synthesized glass samples have been confirmed through Energy Dispersive X-ray Analysis (EDS) and Scanning Electron Microscopy (SEM). The results have been analyzed in view of the modified borate glass network.

Keywords: XRD, FTIR, SEM, EDS, optical basicity and numerical aperture

Corresponding Author How to Cite this Article To Browse
Susheela K Lenkennavar, , Department Of Physics, Bangalore University, Bangalore 560056, Karnataka, India.
Email:
Lenkennavar S, Structural characterisation of Pr3+ ions incorporated sodium lead Barium borate glasses. J.Con.Ma. 2023;1(2):195-202.
Available From
https://jcm.thecmrs.in/index.php/j/article/view/30

Manuscript Received Review Round 1 Review Round 2 Review Round 3 Accepted
2023-11-10 2023-11-15 2023-11-20 2023-11-25 2023-12-01
Conflict of Interest Funding Ethical Approval Plagiarism X-checker Note
None Nil Yes 18.78%

© 2023by Lenkennavar Sand Published by Condensed Matter Research Society. This is an Open Access article licensed under a Creative Commons Attribution 4.0 International License https://creativecommons.org/licenses/by/4.0/ unported [CC BY 4.0].

Introduction

Glasses have made significant contributions to the world of optic electronics and photonics. Generally, phosphorous (P), silicon (Si), and boron (B), and oxides are the most common glass forming oxides. Borate glasses find utility in radiation dosimetry, infrared studies, and as dielectric and insulating materials. These glasses are particularly favoured in forming systems due to their incorporation of unique and diverse structural units. Pure borate glass incorporates the boroxol ring B2O6, characterized by high bond strength and a small cation size. Borate glass also has low refractive index, high melting point and large phonon energy [1-7]. In recent applications, inorganic borate glasses have been extensively employed, especially in the field of photonics. Recently, Because of its significant technological benefits, borate glasses modified with lead ions have acquired a lot of attention. It has been found that, PbO acts both as a network modifier and as a network former in the borate network, depending upon its concentration and network incorporation of PbO has been found to be four-coordinated [8-11].

From the rare earth ions family, Pr3+ ion is an interesting activator because of it emits primary colours for laser action and optical communication window [12]. The lanthanide ions activated materials used broadly as fluorescent and light emitting diodes (LED), a high-performance magnet, biological labels and lasers, telecommunications, luminescent devices, etc. However, Pr3+ has good luminescent properties and low cost, it is the less studied rare earth ion. Emission from Pr3+ is the host dependent when originate from 3P03H4 transition it is green in colour and when originates from 3P03H6, 3F2 is red in colour. Pr3+ has emission range from UV to IR region and has so many applications such as fiber amplifiers, fiber lasers and up-conversion lasers [13-20].

Synthesis and characterization 

The conventional melt quenching technique was employed to synthesize the samples of calcium sodium lead Barium borate glasses doped with rare earths (20Na2O - 10PbO – 10BaO - 60B2O3). Separate batches were created for each mol% of the rare earth element (Pr,). Homogeneous mixing of analytical grade sodium

carbonate, barium carbonates, lead oxide, boric acid, and the rare earth oxides (99.99% pure praseodymium) was achieved in agate and mortar for about 30 minutes. The batches were then melted in porcelain crucibles at temperatures between 1030 °C and 1050 °C for 45 minutes, with continuous stirring to assure homogeneity. Subsequently, the molten material was rapidly flowed into preheated brass molds to form pellet-shaped samples. These samples were later polished for further analysis.

We performed XRD measurements to confirm the amorphous nature of the samples, using Cu-Kα radiation (λ = 1.54 Å) with copper filters at 40 kV and 100 mA. We utilized a Rigaku Ultima IV instrument for this purpose.  Additionally, we determined the physical parameters, including density and refractive index. The glass samples' density (ρ) was estimated using Archimedes' principle, with toluene as the submersion liquid. Refractive indices (n) were measured at 589.3 nm (sodium wavelength) using an Abbe's refractometer (Model CL: 1.30-1.71), with mono-bromo-naphthalene as the contact liquid. We conducted Fourier transform infrared (FTIR) transmission measurements across the range of 400–4000 cm⁻¹ using a Thermo Nicolet Avatar 370 spectrometer with a resolution of 4 cm⁻¹, employing the KBr pellet technique. Additionally, we obtained Scanning Electron Microscopy (SEM) images, along with Energy Dispersive X-ray Analysis (EDS), were acquired at room temperature using a CARL ZEISS FESEM (Oxford Instruments). This setup was employed for the morphological examination of the synthesized glass samples.

Physical parameters

Measurement of density (ρ) involves determining sample’s weight in air (Wa) and its weight when immersed in toluene, which has a known density (ρx=0.8669 g/cm³) as indicated in equation (1).

jcm_30_1.jpg
The calculation of molar volume (Vm) is based on the molecular weight (M.W) of the the synthesized sample, as outlined in equation (2).

jcm_30_02.jpg


One can express molar refractivity (Rm) in terms of refractive index and molar volume Vm, as outlined in the equation (3).

                 jcm_30_3.jpg

Polarizabilities (αm) of these glasses can be determined using the relationship described in equation (4), which involves molar refractivity (Rm) and Avogadro's number (NA).

                jcm_30_4.jpg
The calculation concentration of rare earth utilizing the weight (x) of rare earth ions (RE), molecular weight (y) of rare earth ions (RE), Avogadro's number (NA), and the glass density (ρ), as specified in equation (5).

                    jcm_30_5.jpg
Interionic distance (ri) and Polaron radius (rp) can be calculated based on the concentration of rare earth ions (Ni), as per equations (6), respectively.

jcm_30_6.jpg
Here, utilizing the polaron radius the field strength (F) is computed, with Z representing the charge of the rare earth ion.

jcm_30_7.jpg
The square of the refractive index is used to calculate the dielectric constant (ε), utilizing refractive index, reflection loss (RL%) of samples can be computed, as outlined in equation (8).

jcm_30_8.jpg
To explain the optical behavior of glasses, the correlation between refractive index, electro negativity, interaction parameter, and optical basicity is important.  We calculated the theoretical optical basicity (Λth) for the present glass system using the relation proposed by Duffy and Ingram, which is expressed as:

jcm_30_9.jpg

where X1, X2, X3, ---Xn are represents equivalent mole fractions of different oxides, indicating the amount of oxygen each oxide contributes to the overall glass stoichiometry and Λ1, Λ2, Λ3, Λ4…..Λn are optical basicity values of the constituent oxides.

We calculate the oxide ion polarizability using the following relation,

jcm_30_10.jpg
Electro negativity (c) is estimated utilizing the following relation,
jcm_30_11.jpg
Electric susceptibility (ce) is estimated utilizing the following relation,

jcm_30_12.jpg
Numerical aperture (NA) is calculated utilizing the following,

jcm_30_13.jpg
Where, D is fractional RI change (0.01).

Optical packing density is calculated by,

jcm_30_14.jpg
Where, n is oxygen atoms in composition, m is molecular weight, and ρ is density.

We estimated several physical parameters, which are presented in Table.

Results and Discussion

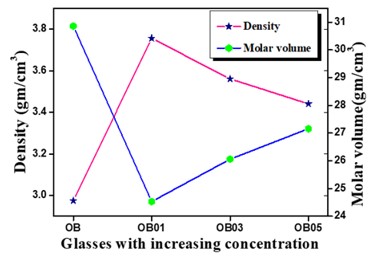
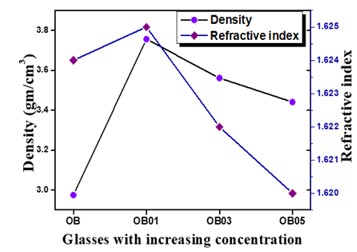
Density serves as a valuable parameter for assessing the compactness of the structure, as well as for examining alterations or modifications in coordination, geometrical configurations, and changes in the dimensions of the glass network lead to the expected inverse relationship between molar volume and density. This variation of the present glasses doped with different concentrations of Pr2O3 is depicted in Figure1. Furthermore, the glasses exhibit a high refractive index, making them desirable candidates for optical fiber glass applications. The relationship between refractive index and density is depicted in Figure


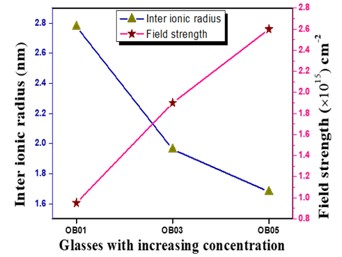
2. The findings indicate that as the concentration increases, there is a decrease in the inter-ionic distance, resulting in an increase in the field strength of the Pr3+ ion within the synthesized host matrix. This changes in inter-ionic distance and field strength are clearly illustrated in Figure 3. Additionally, glasses with higher average molecular weight exhibit smaller interionic distance values [21-22].

Density serves as a valuable parameter for assessing the compactness of the structure, as well as for examining alterations or modifications in coordination, geometrical configurations, and changes in the dimensions of the glass network lead to the expected inverse relationship between molar volume and density. This variation of the present glasses doped with different concentrations of Pr2O3 is depicted in Figure1. Furthermore, the glasses exhibit a high refractive index, making them desirable candidates for optical fiber glass applications. The relationship between refractive index and density is depicted in Figure 2. The findings indicate that as the concentration increases, there is a decrease in the inter-ionic distance, resulting in an increase in the field strength of the Pr3+ ion within the synthesized host matrix. This changes in inter-ionic distance and field strength are clearly illustrated in Figure 3. Additionally, glasses with higher average molecular weight exhibit smaller interionic distance values [21-22].

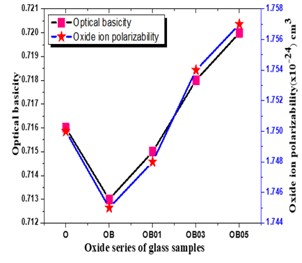
With an increase in praseodymium concentration, it is observed that there is a slight rise in optical basicity, leading to increased polarizability. Consequently, this results in an

jcm_30_15.jpg
Figure 1: Plots of density v/s molar volume

jcm_30_16.jpg
Figure 2: Plots of refractive index v/s density

jcm_30_17.jpg
Figure 3: Plots of inter-ionic v/s field strength

jcm_30_18.jpg
Figure 4: Plots of optical basicity v/s oxide ion polarizability

increase in the refractive index [23-27]. The variation in optical basicity and oxide ion polarizability in the series of oxide glass samples is presented in Figure 4. The numerical aperture values fall within the range of 0.13-0.5, these glasses can serve as core materials in optical


fibers, effectively accepting a substantial amount of light from the source. The numerical aperture values for the synthesized present glasses range between 0.22-0.23, clearly indicating their potential as candidates for optical fiber applications. Additionally, these glasses exhibit significantly low reflection loss (less than 6%) and possess a high refractive index compared to previous reports, making them well-suited for fiber applications [25-31].

Table 1: Estimated Physical Parameters

Physical propertiesOBOB01OB03OB05
Refractive index (RI)1.6241.6251.6251.622
density  (r) gm/cm32.9753.7563.5613.441
Molar refractivity (Rm)cm-310.8948.6709.1749.538
Molar volume (Vm)g/cm330.8624.5326.0627.16
Molar polarizability (αm)×10-24cm34.3143.4333.6323.777
Reflection loss(RL)%,5.6555.6695.6275.687
Dielectric constant(ε), 2.6372.6402.6302.624
Concentration (Ni)×1020 ions/cc.-0.4891.3862.216
Polaron radius (rp)nm-1.7761.2561.074
Inter ionic distance (ri) nm-2.7761.9621.680
Field strength(F) ×1014cm2-0.9511.9012.60
Optical basicity (Λth)0.7130.7150.7180.720
Oxide ion polarizability1.7451.7481.7541.757
Electro negativity (c)1.2001.2031.2071.210
Oxygen packing density77.7797.8392.0988.36
Numerical aperture (NA)0.2290.2990.2990.299
Electric susceptibility (ce)0.1300.1300.1290.129

X-ray diffraction

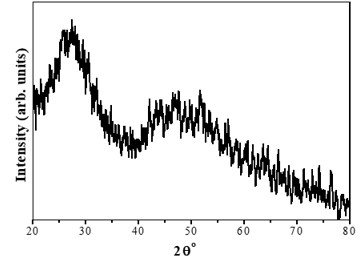
The X-ray diffraction patterns for all the synthesized glasses were obtained within the range of 200 to 800, at room temperature. These XRD patterns did not exhibit any distinct, sharp peaks. Instead, they revealed a broad, diffuse scattering, particularly at lower angles. This observation suggests the presence of a significant long-range structural disorder within the glasses being studied. The appearance of such a diffused, broad peak is a characteristic indicator of the amorphous nature of the samples [1-9]. It thereby confirms that the synthesized samples are indeed amorphous in nature. Notably, the XRD patterns for all the samples exhibit a consistent similarity, as illustrated in the accompanying figure 5.

Fourier transformation of spectroscopy (FTIR) analysis of OB glass matrix

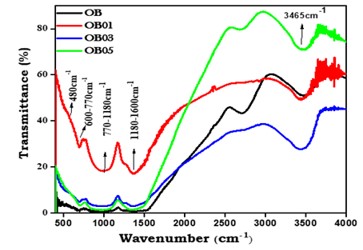
We conducted FTIR analysis to gain essential insights into the arrangement of structural units within the glasses. In the glass network, we assumed that the vibrations of structural units are independent of those of neighbouring units. Given the high concentration of borate, it is expected that the major vibration modes are attributed to borate units, as illustrated in Fig 6.

The FTIR spectrum of these glasses reveals five prominent bands spanning approximately 600-770 cm⁻¹, 770-1180 cm⁻¹, 1180-1600 cm⁻¹, as well as distinct bands around 2300 cm⁻¹, 2730 cm⁻¹, and 3465 cm⁻¹. Additionally, a weak band at around 480 cm⁻¹ is observed. The band below 600 cm⁻¹ can be attributed to cage vibrations of metal ions like Pb²⁺, Ba²⁺, and Sr²⁺ [32]. The band within the 600-770 cm⁻¹ range arises from B-O-B linkages (diborate linkage) [32-33]. Fig 6 indicates that with the incorporation of rare earth elements, intensity of the diborate linkage band increases into the network. The presence of lead oxide in borate glasses can result in the formation of three and four-coordinated boron units, leading to a Pb-O-B bending phenomenon that results in [PbO⁴/²]²⁻ or pyramidal units of metal ions overlapping with [BO³] triangles [31]. The bands at approximately

jcm_30_19.jpg
Figure 5: X-ray diffraction of OB glass matrix

jcm_30_20.jpg
Figure 6: FTIR spectra of OB glasses matrix

3465 cm⁻¹, 2730 cm⁻¹, 2300 cm⁻¹, and are assigned to -OH bonding, molecular water and hydrogen bonding.  Absence of the absorption peak at ~ 806 cm-1 indicates that absence of boroxol ring which means that glass structure consists of BO3 and BO4 groups [24-33].


jcm_30_21.jpg
Figure 7: SEM image (80 µm) of OB glass matrix

jcm_30_22.jpg
Figure 8: SEM image (70 µm) of OB glass matrix

jcm_30_23.jpg
Figure 9: EDS a spectrum of OB

Scanning Electron Microscopy (SEM)

The SEM images of the OB glass matrix are presented in Figure 7 and Figure 8. The SEM images confirm the amorphous nature of the praseodymium-incorporated alkaline sodium lead borate samples, displaying clear and smooth glassy surface morphology without any clustering formations [34-36]. It should be noted that all glass samples exhibited a similar amorphous nature, with no observable grain or microstructure formations, further affirming the amorphous character of the prepared glasses.


Energy Dispersive X-ray Spectra (EDS)

The EDS provide insights into the composition of the synthesized glass samples. The Energy Dispersive X-ray Analysis (EDS) spectrum presents a comprehensive view of the elements present in the synthesized glass samples, quantifying their relative concentrations [34-36]. In Figure 9, the EDS spectrum for OB is presented, offering identification of all elements found within the examined glass samples, expressed as percentages. All the glass samples were found to exhibit a similar elemental composition.

Conclusions

We employed Fourier Transform Infrared (FTIR) spectroscopic and X-ray diffraction (XRD) analysis to investigate structural changes in the glass network and to confirm the crystalline or amorphous nature of the samples. Additionally, we determined the density and molar volume to examine the physical properties of the glasses. The densities of the fundamental structural units BO3 and BO4 can serve as indicators for comprehending the variations in glass density. The rise in the concentration of BO4 units, which possess a higher density than BO3 units, accounts for the reduction in molar volume in the prepared samples. The NBO groups will increase as the RE content increases. The refractive index is significantly influenced by the presence or reduction of non-bridging oxygen (NBO). In particular, NBO results in the formation of more ionic bonds, leading to greater polarizability compared to the covalent bonds of bridging oxygen. This increased polarizability is responsible for the elevated refractive index. The molar refraction is primarily contingent on the material's polarizability. The utilization of molar refractivity emphasizes the significance of ionic packing in regulating a glass's refractive index. The SEM images shows clear and smooth surface morphology with no clustering formation and confirms the amorphous nature. The EDS spectra give the identification of all elements present in the investigated glass samples in terms of percentages.

Acknowledgement

We thank Bangalore University (UNI.ORDER.No.DEV: D2a:BU-RP:2020-21) for funding.


Author (SKL) expresses gratitude to the late Prof. R.V.A for his guidance and valuable suggestions.

References

1. A. Abd El-Moneim, H.Y. Alfifi, Part I, Mater. Chem. Phys. 207 (2018) 271–281.

2. M.K. Halimah, W.M. Daud, H.A.A. Sidek, Ionics 16 (2010) 807–813.

3. I.Z. Hager, Mater. Chem. Phys. 109 (2008) 365–372.

4. S. Laila, A.K. Suraya, A.K. Yahya, Chalcogenide. Lett. 11 (2) (2014) 91–101.

5. M.A. Sidkey, A. Abd El-Moneim, L. Abd El-Latif, Mater. Chem. Phys. 61 (1999) 103–109.

6. A. Abd El-Moneim, Mater. Chem. Phys. 70 (2001) 340–343.

7. M.A. Sidky, R. El-Mallawany, R.I. Nakhla, A. Abd El-Moneim,J. Non-Cryst. Solids 215 (1997) 75–82.

8. V. Rajendran, N. Palanivelu, D.K. Modak, B.K. Chaudhuri, Phys. Stat. Sol. (a) 180 (2000) 467–477.

9. A. Abd El-Moneim, H.Y. Alfifi, Phys. Chem. Glasses: Eur. J. Glass. Sci. Technol. B 59 (2018) 97–105.

10. V.C.V. Gowda, R.V. Anaveker, Ionics 10 (2004) 103–108.

11. V.C.V. Gowda, R.V. Anaveker, K.J. Rao, J. Non-Cryst. Solids 351 (2005) 3421–3429.

12. A. P. Vink, P. Dorenbos, C.W.E. Van-Eijk, J. Solid State Chem., 171(2003) 308

13. S. Kück, I. Sokólska, M. Henke, M. Döring, T. Scheffler, J. Lumin., 102–103(2003) 176

14. A. M. Srivastava, D.A. Doughty, W.W. Beers, J. Electrochem. Soc., 144(1997) L190

15. B. Denker, Hand book on solid state lasers, Wood head Publishing Limited, 2013.

16. J. Yang, B. J. Chen, E. Y. B. Pun, B. Zhai, H. Lin, Optics Express, 1031(2013) 21.

17. Qiuchun Sheng, Xiaolin Wanga, Danping Chen, J. Lumin., 135 (2013) 38.

18. J. Anjaiah, C. Laxmikanth, N. Veeraiah, Physica B, 454 (2014)148.

19. Yujin Chen, Yidong Huang, Miaoliang Huang, Ruiping Chen, Zundu Luo, J. Am. Ceram. Soc., 88 (2005) 19.

20. Renata Reisfeld, Christian K Jorgensen, Lasers and excited states of rare earths, Springer –Berlin, New York, 1977.

21. S. Dahiya, A.S Maan, R. Punia, R.S. Kundu, S. Murugavle, AIP Conf. Proc. 1512 (2013) 566-567.

22. B. Bendow, P.K. Benerjee, M.G. Drexhage, J. Lucas, J. Am. Ceram. Soc. 65 (1985) C92.

23. L. Jyothi, V. Venkatramu, P. Babu, C.K. Jayasankar, M. Bettinelli, G. Mariotto, A.Speghini, Opt. Mater. 33 (2011)
928.

24. N. Sooraj Hussain, P.J. Cardoso, G. Hungerford, M.J.M. Gomes, Nasar Ali, J.D.Santos, S. Buddhudu, J. Nanosci.
Nanotechnol. 9 (6) (2009) 3555.

25. G. Fuxi, Optical Properties of Glass, Springer, Berlin, 1992.

26. J.S. Hayden, Y.T. Hayden, J.H. Campbell, SPIE, 1277 (1990) 121.

27. Shibin Jiang, Tao Luo, Bor-Chyuan Hwang, Fred Smekatala, Karine Seneschal, Jacques Lucas, Nasser Peyghambarian,
Journal of Non-Crystalline Solids, 263(2000) 364.

28. V. Dimitrov, T. Komatsu, Journal of the University of Chemical Technology and Metallurgy, 45, 3, 2010.

29. V. Dimitrov, S. Sakka, J. Appl. Phys. 79 (1996) 1736.

30. J.R. Tessman, A.H. Kahn, W. Shockley, Phys. Rev. 92 (1953) 890.

31. J.A. Duffy, M.D. Ingram, in: D. Uhlman, N. Kreidl (Eds.), Optical Properties of Glass, American Ceramic Society,
Westerville, 1991.
32. Kamitsos et. al, J. Phy. Chem, 91, (1987)1073, W.A.Pisarski et. al, Materials Science & Eng. B, 122 (2005) 94.

33. Feng He et. al, A.J. Chem.,5, (2015)142.

34. K. Mariselvam, R. Arun Kumar, Universal Journal of Chemistry 4 (2016) 55-64.


35. M. Parandamaiah, S. Venkatramana Reddy, A.V. Chandrasekhar, International Journal of Advanced Research in Science,
Engineering and Technology, 3 (2016) 2720-2729.

36. H. Smogor T. Cardinal, V. Jubera, E. Fargin, J.J. Videau, S. Gomez, R. Grodsky, T. Denton, M. Couzi, M. Dussauze,
Journal of Solid-State Chemistry, 182 (2009) 1351–1358.